Turn any PDF into an editable PowerPoint.
Dekked lifts the figures out of your document and rebuilds your tables as real, editable PowerPoint charts you can re-plot — not screenshots you can't touch.
No card needed · Native .pptx, charts still editable
Real decks. Real charts.
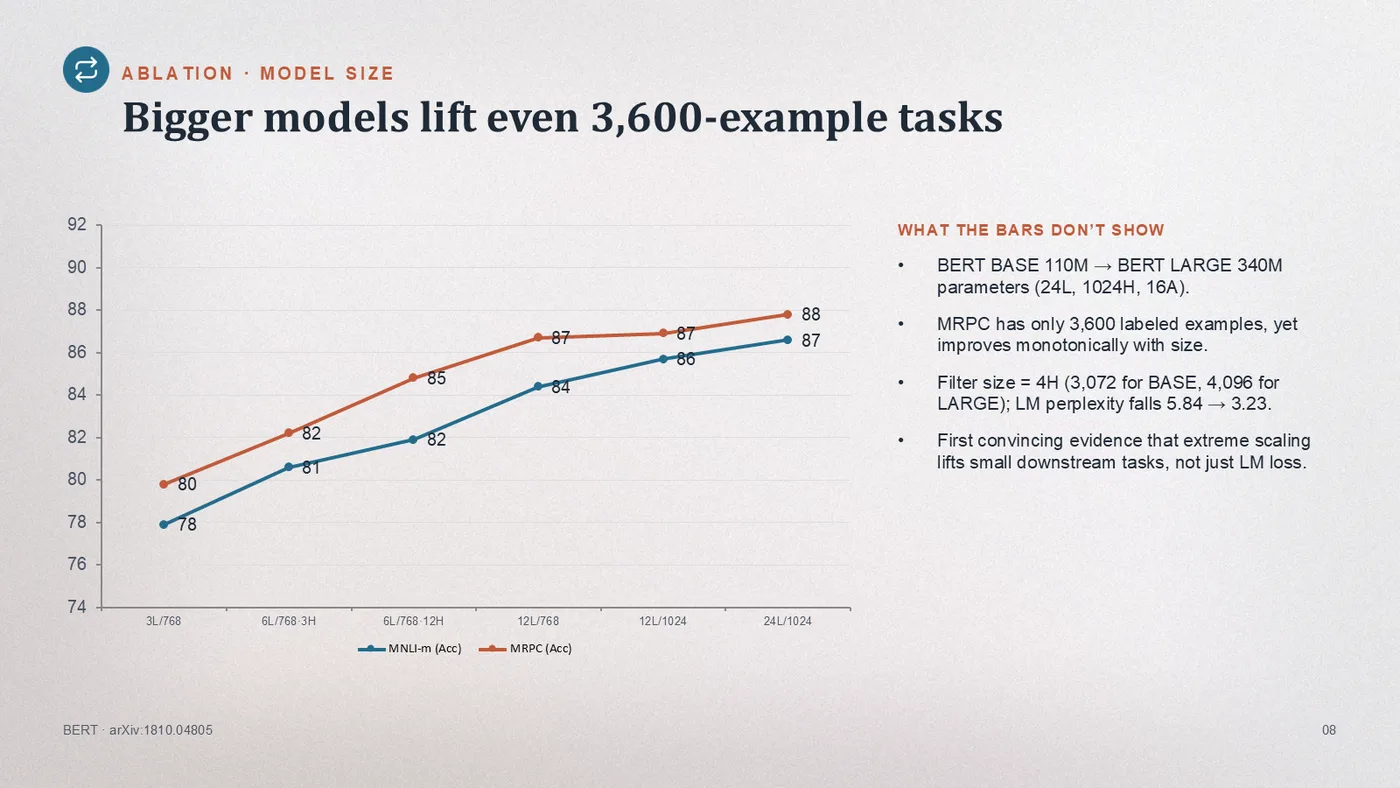
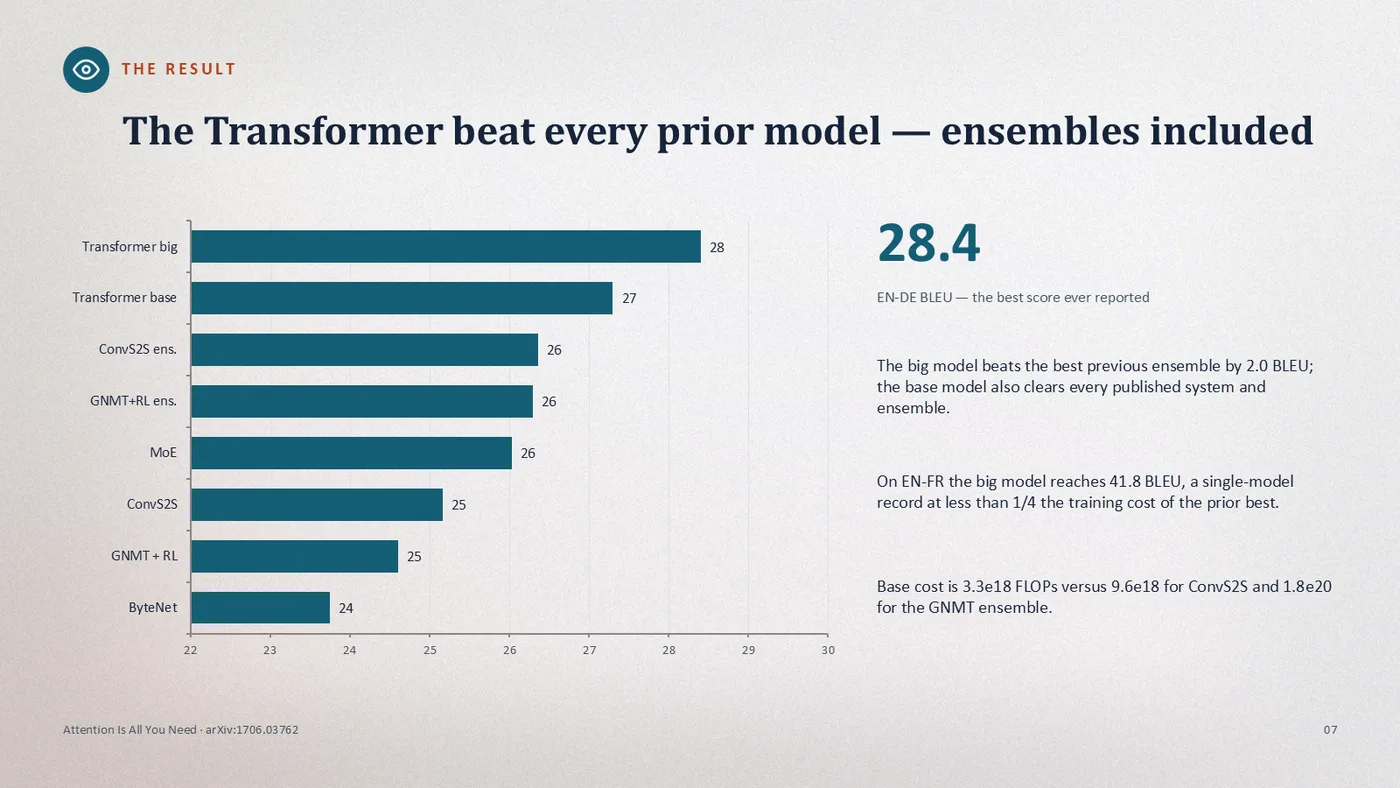
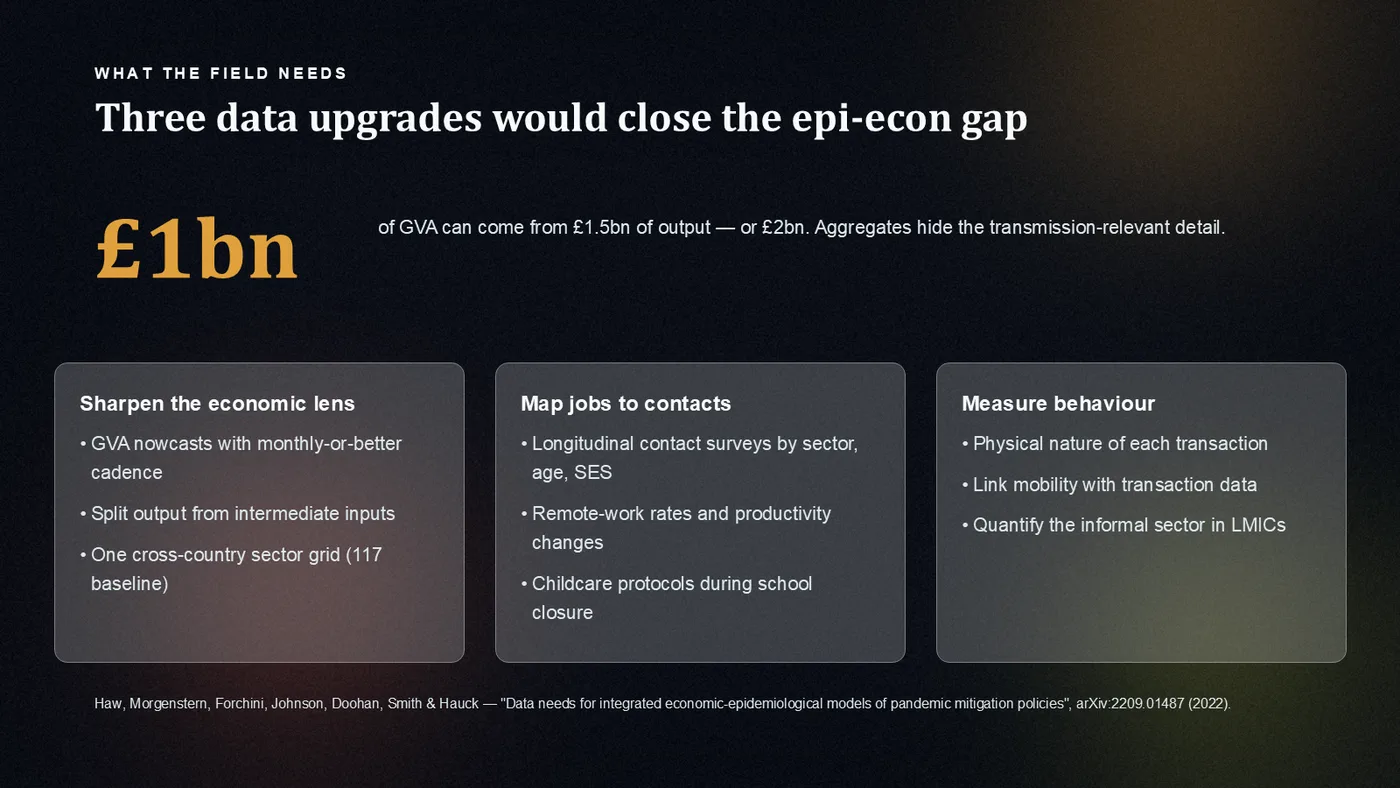
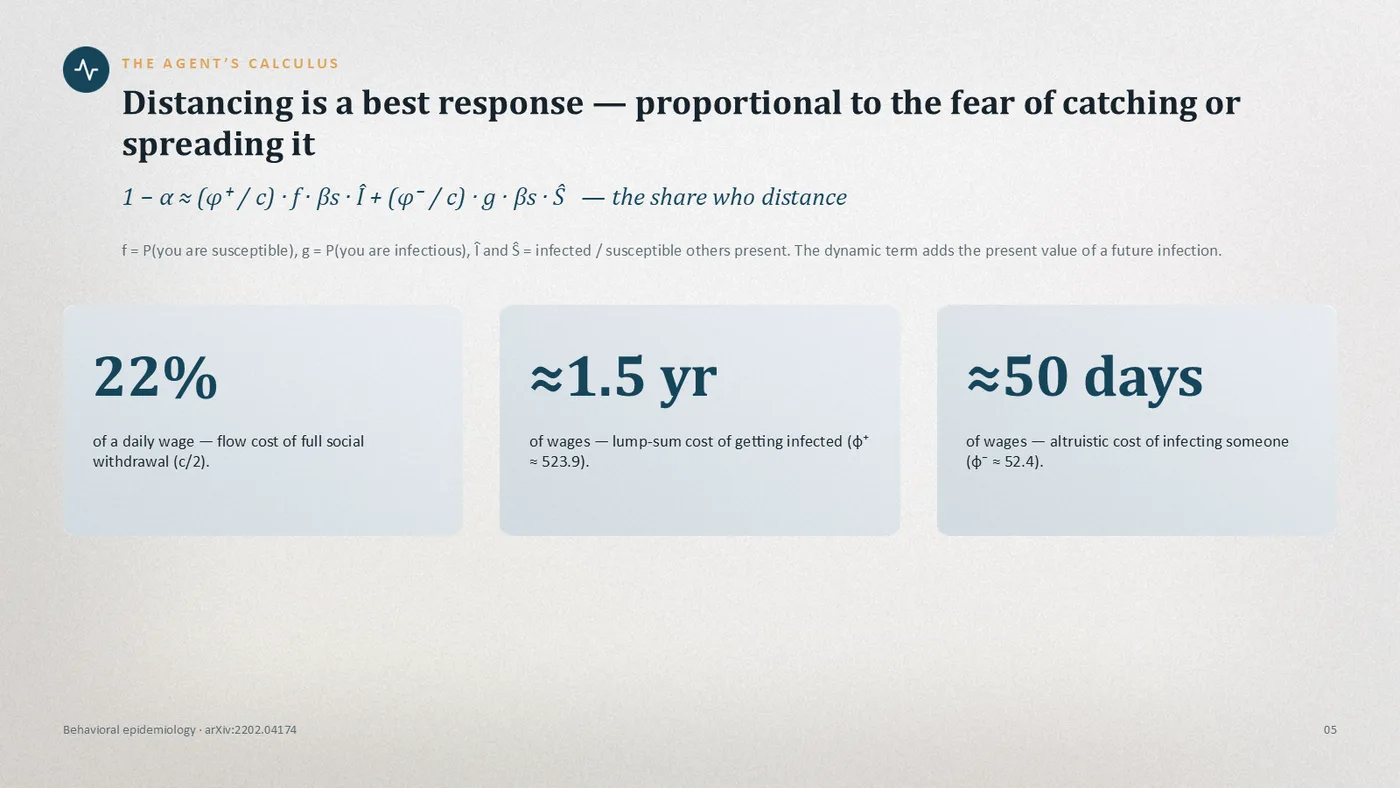
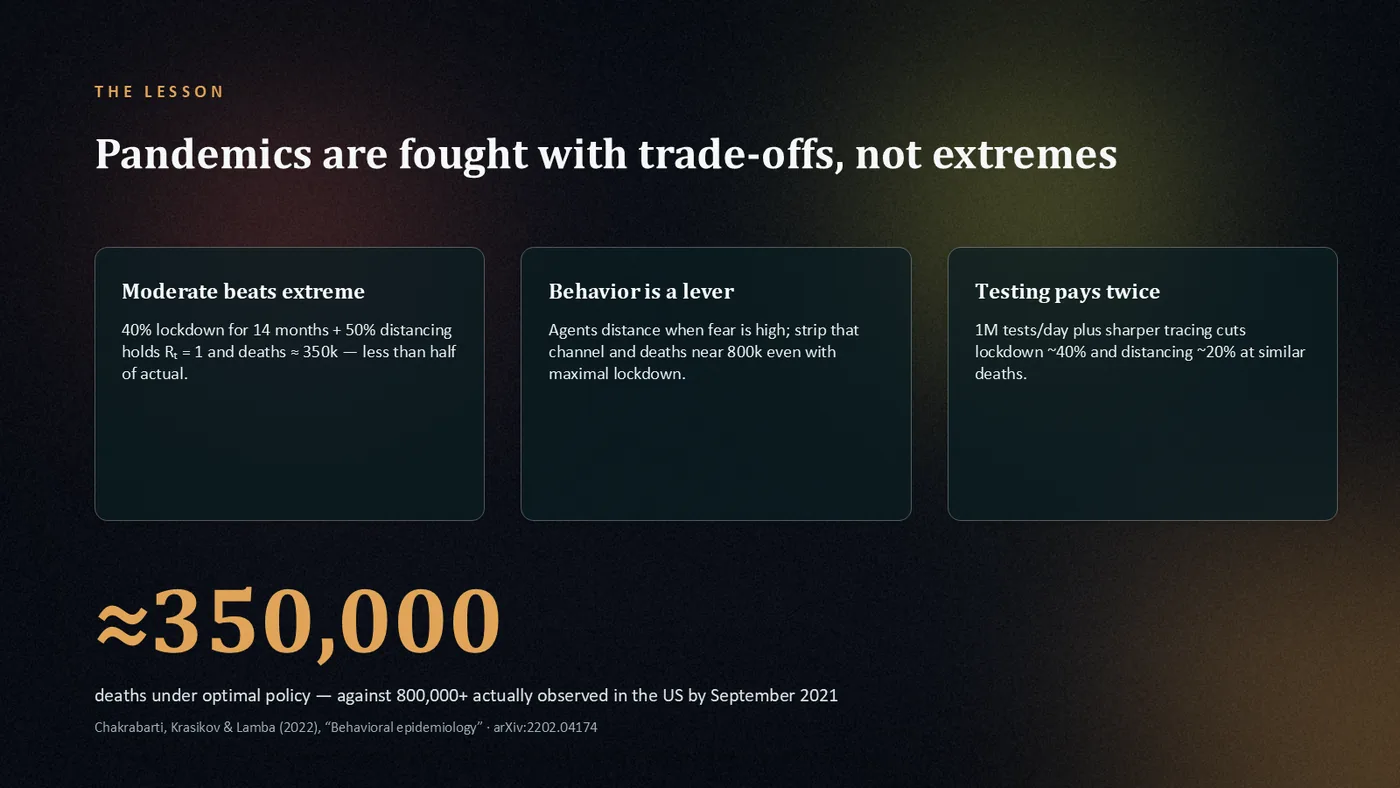
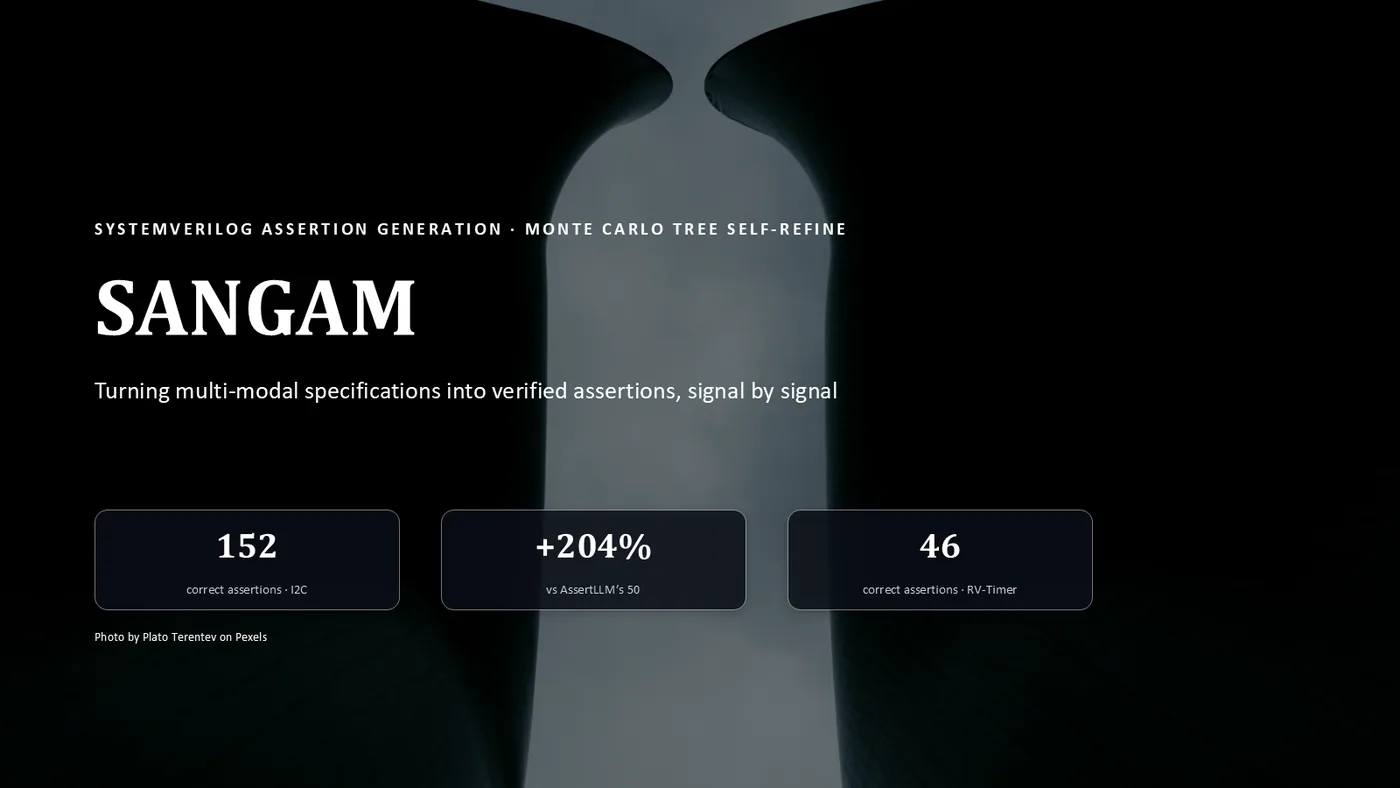
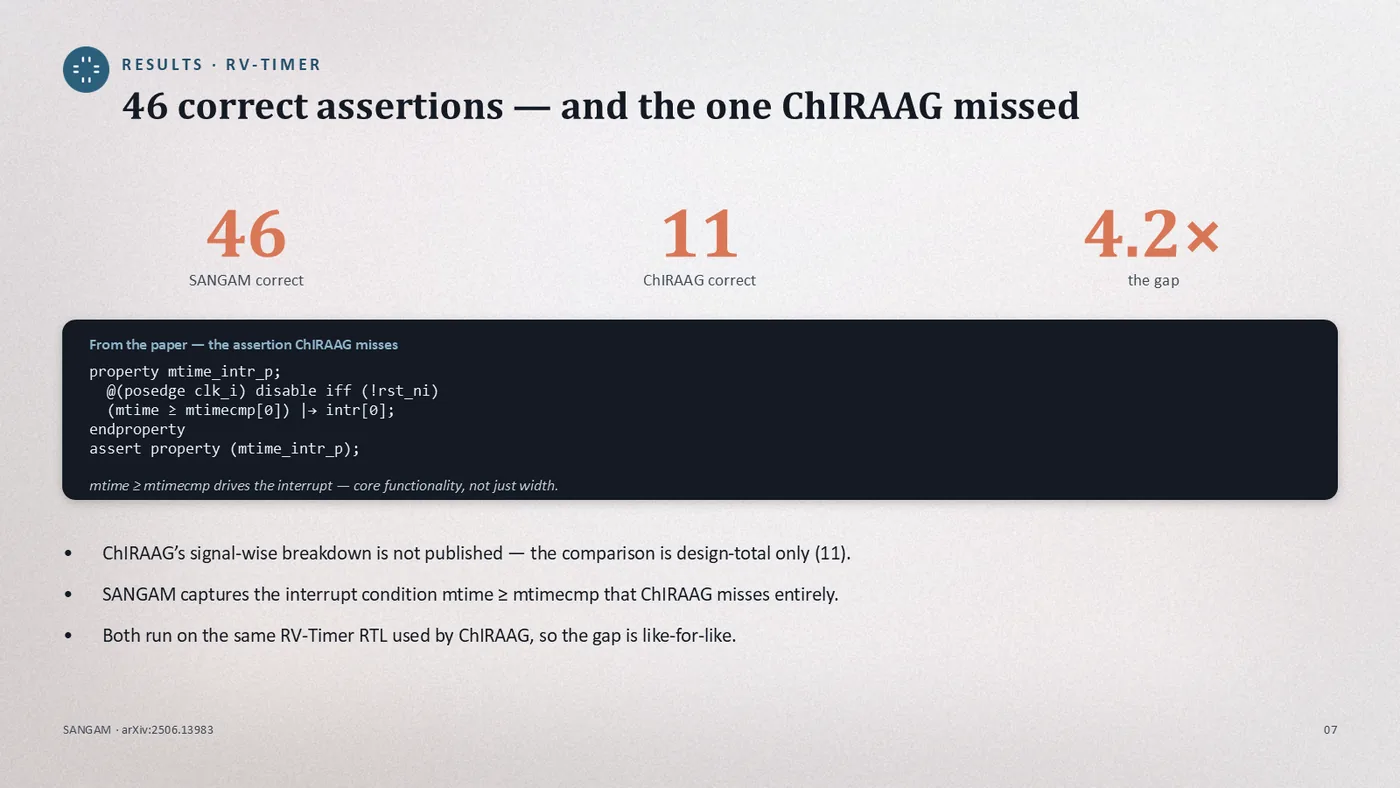
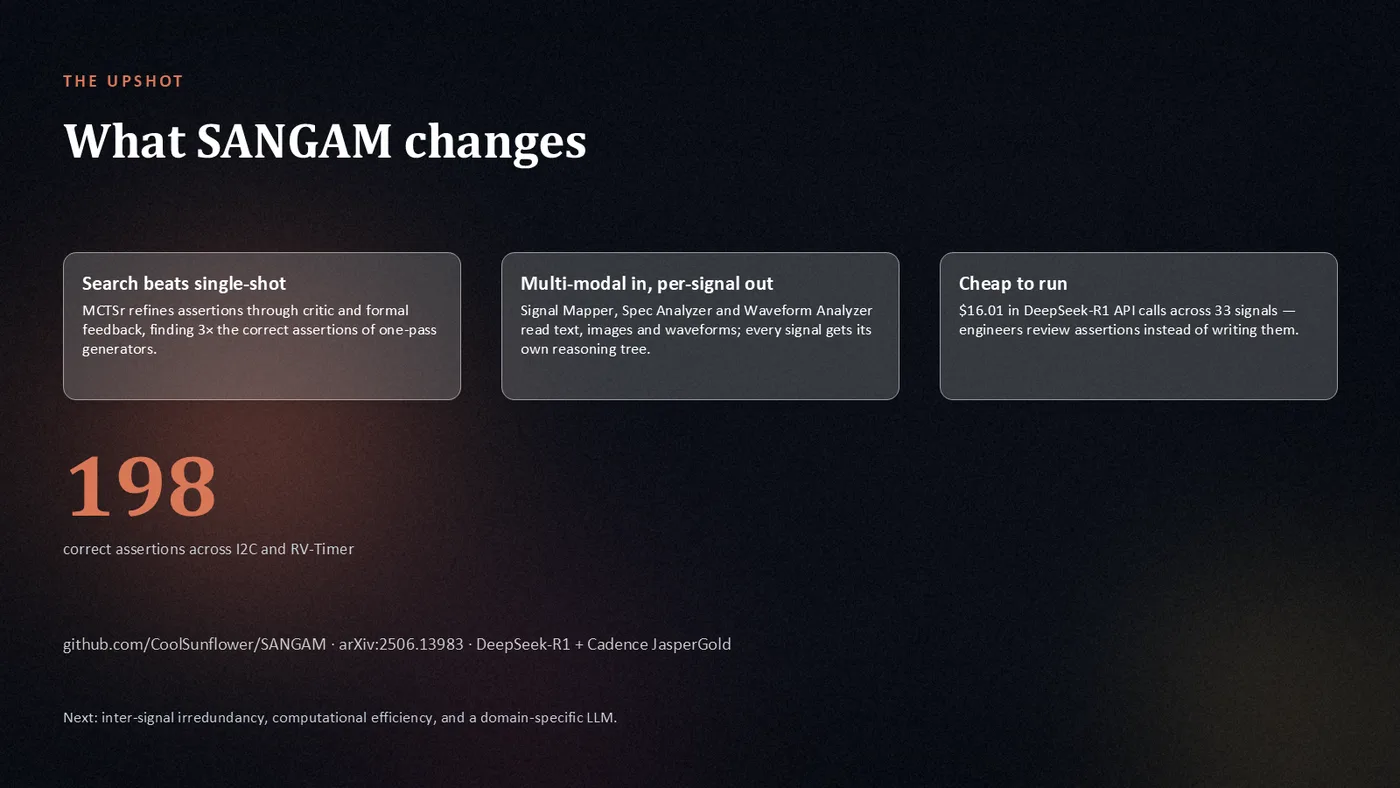
Slides Dekked generated from public papers — native charts, rebuilt tables, extracted figures. Click any tile to read where it came from.
Every slide here is unretouched engine output.
Drop a PDF. Get a deck you can keep editing.
Three steps, shown with the real product.
Drop
Attach a paper, report or thesis and describe the deck you need. That's the whole brief.
Build
Every slide gets designed, rendered, and reviewed — a finished deck in under an hour.
Edit
Open the .pptx in PowerPoint and keep working — text, shapes and charts are all live objects.
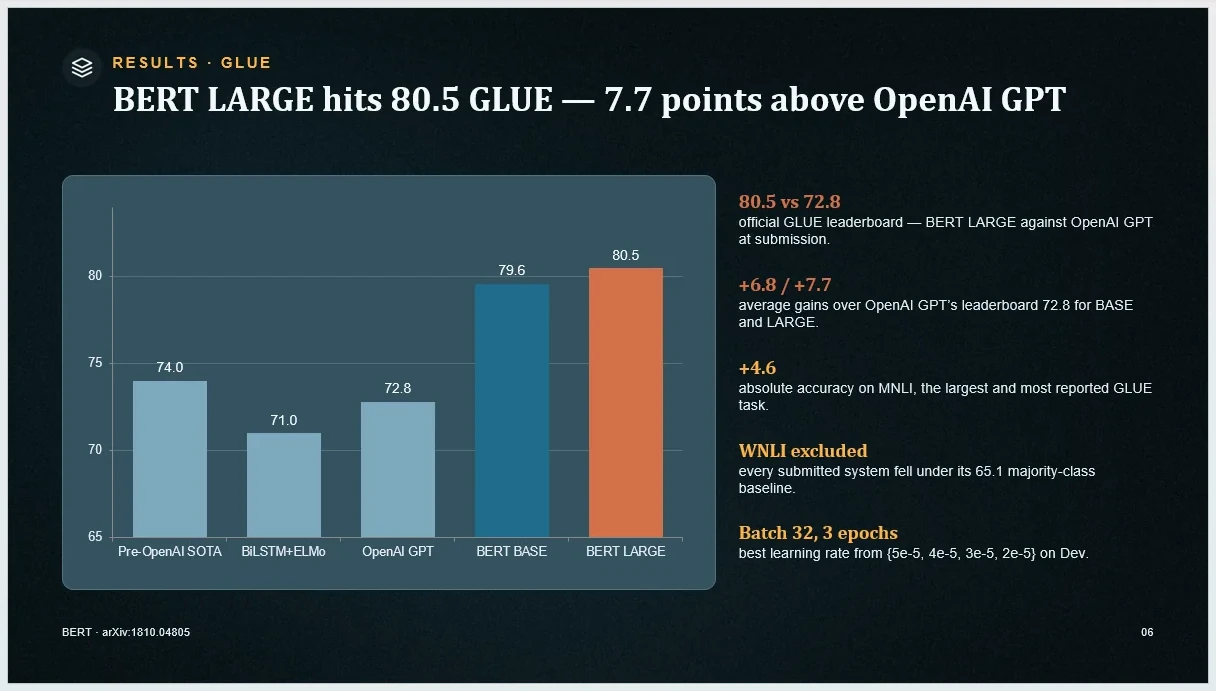
Charts stay charts.
Most AI tools hand you a picture of a chart. Dekked hands you the chart — select it in PowerPoint, open Edit Data, and the numbers are live in cells.
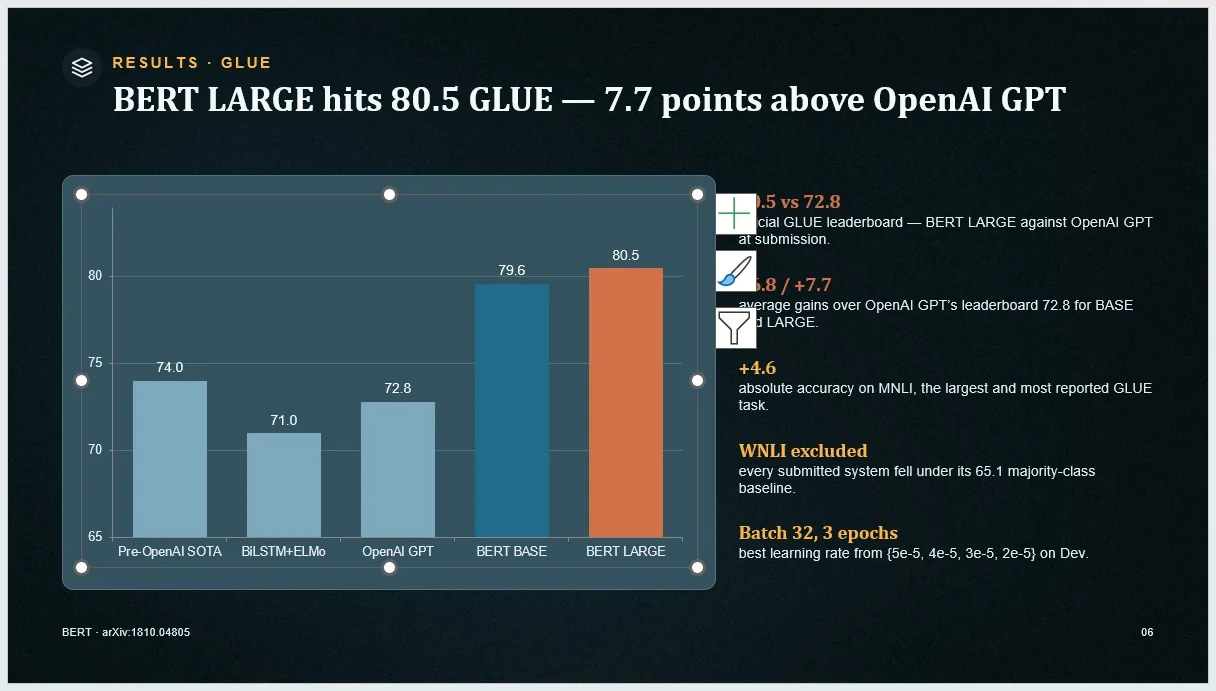
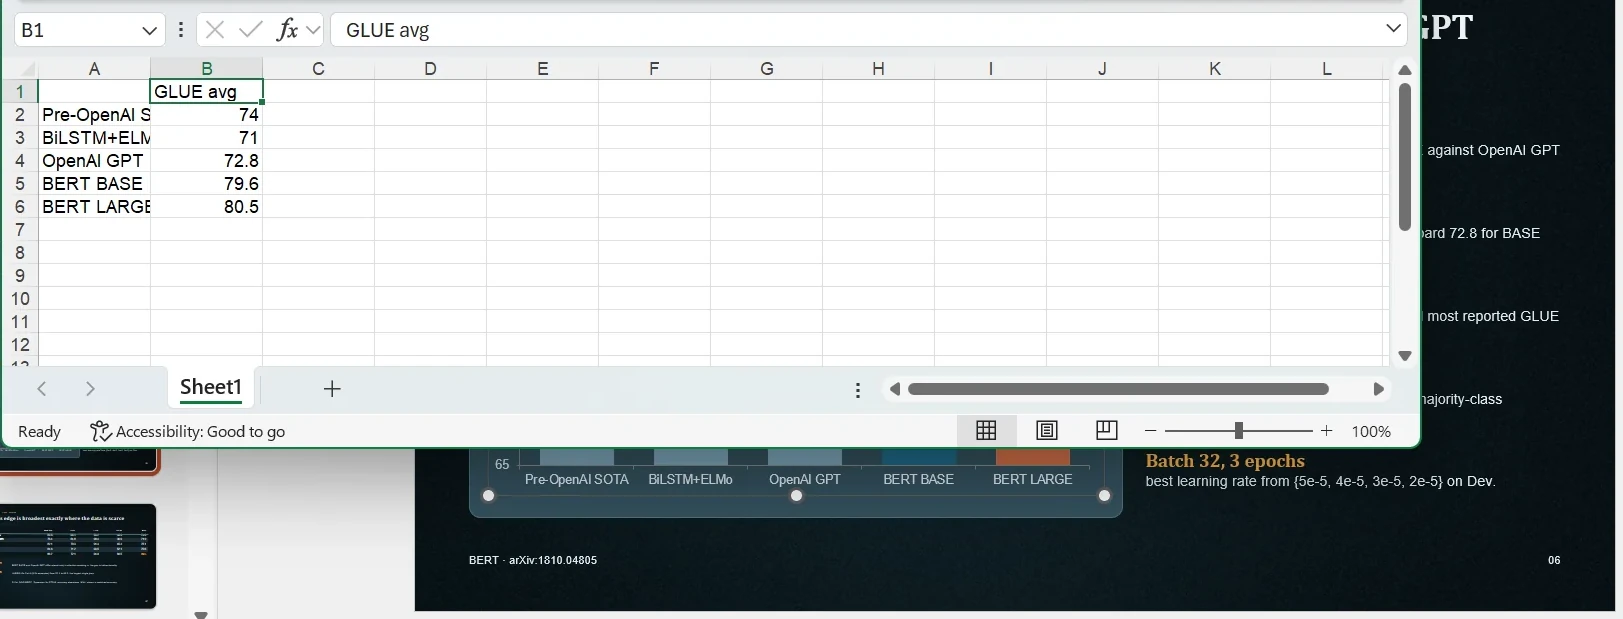
Every frame is a straight screen capture of desktop PowerPoint with a real generated deck open.
The engine keeps count.
Lifetime totals from the Dekked engine — everything it has designed, rendered, and reviewed to date.
Built by a researcher who got tired of rebuilding figures by hand.
 Illustration
For the researcher with a paper and a deadline.
 Illustration
For the consultant who presents other people’s data.
 Illustration
For the founder pitching what the numbers prove.
Pay per deck — no subscription to forget to cancel.
Your uploads are deleted from our servers after processing — source files within 30 minutes, generated decks within 2 hours.
Start free. Pay only when you need more.
Your first deck is free — watermarked, no card required. After that, pricing that scales with how much you ship.
- Up to 15 slides
- 4 AI images per deck
- No watermark
- Up to 15 slides each
- Credits valid 30 days
- No watermark
- Up to 20 slides
- Custom template upload
- Speaker notes
- Presentation history
- Everything in Standard
- Multi-language / RTL
- Credit rollover
- 30-day re-download
Guides & comparisons
Compare the tools. Read the workflows.
How Dekked stacks up against the tools you already know — and how researchers and consultants put it to work.
FAQ
Questions researchers and analysts ask before switching.
Yes. Dekked builds native PowerPoint objects — real chart objects you can double-click to change the underlying data, plus text boxes, shapes, and tables you can edit directly. Nothing is a flattened image or a screenshot, so you keep full control after download.
Your uploads are processed only to build your deck, and the source files are deleted from our servers after your deck is built — uploads within about 30 minutes, build files within two hours. We never use your documents to train our own models.
Many AI presentation tools build slides as HTML web pages first, then convert to PPTX — a process that can break layouts, alter fonts, and trigger repair dialogs. Dekked is a native PPTX generator: slides are built directly as PowerPoint objects, so exports open cleanly in Microsoft PowerPoint, Google Slides, and Keynote. Dekked also extracts figures, charts, and tables from your source PDFs and embeds them into slides — the only tool we've tested that lands your source-PDF figures on slides as real objects.
Yes. Upload any PDF — research papers, annual reports, business documents, or academic theses — and our AI extracts the text, tables, and figures, then generates a professional slide deck with real editable charts, proper layouts, and your original diagrams embedded. The output is a native .pptx file that works in PowerPoint, Google Slides, and Keynote.
Yes. Upload any .pptx template and our AI analyzes its colors, fonts, and slide master layouts, then generates slides that follow your template precisely. This works with corporate brand guidelines, university thesis templates, and conference presentation formats. Custom template upload is available on Standard and Premium plans.
Dekked uses a credit-based pricing model. New users get 1 free presentation to try the platform. After that, presentations start at $1.99 for a single deck (Pay As You Go), $9.99 for a 7-presentation credit pack, or $11.99/month for the Standard subscription with 10 presentations per month plus custom templates and speaker notes.
Yes. Dekked creates real, editable PowerPoint charts (bar, line, pie, doughnut), diagrams (flow, cycle, pyramid, radial, funnel, matrix), stat callouts, timelines, dashboards, and comparison slides. Data is sourced from your uploaded documents or web research to prevent hallucinated statistics. All charts and diagrams are native PowerPoint objects — fully editable after download.
Dekked generates presentations in English, Arabic (with full RTL support), Spanish, French, and German. All slide content — titles, bullet points, chart labels, speaker notes, and diagram elements — is produced in the selected language. Multi-language generation is available on Premium plans.
Yes — every element is fully editable. Unlike AI tools that export screenshots or flat images, Dekked builds native PowerPoint objects. Text boxes, charts, diagrams, and shapes can all be modified, resized, and reformatted directly in Microsoft PowerPoint, Google Slides, or Keynote. You own the file completely.
Upload your PDF directly to Dekked. The AI reads the paper structure — abstract, methodology, results, conclusion — and generates an appropriate slide sequence. Figures and charts embedded in the PDF are extracted and placed on relevant slides. For academic defenses, select an education template and choose up to 20 slides for comprehensive coverage.
You can still generate a presentation by describing your topic. When no document is uploaded, Dekked researches the web for current facts and data to build your slides. For the best results, uploading a source document is recommended — it gives the AI specific data to work with and avoids generic content.
Yes. We offer a 7-day money-back guarantee on all purchases — both one-time credit packs and subscriptions. If you’re not satisfied with Dekked, email support@dekked.app for a full refund, no questions asked.
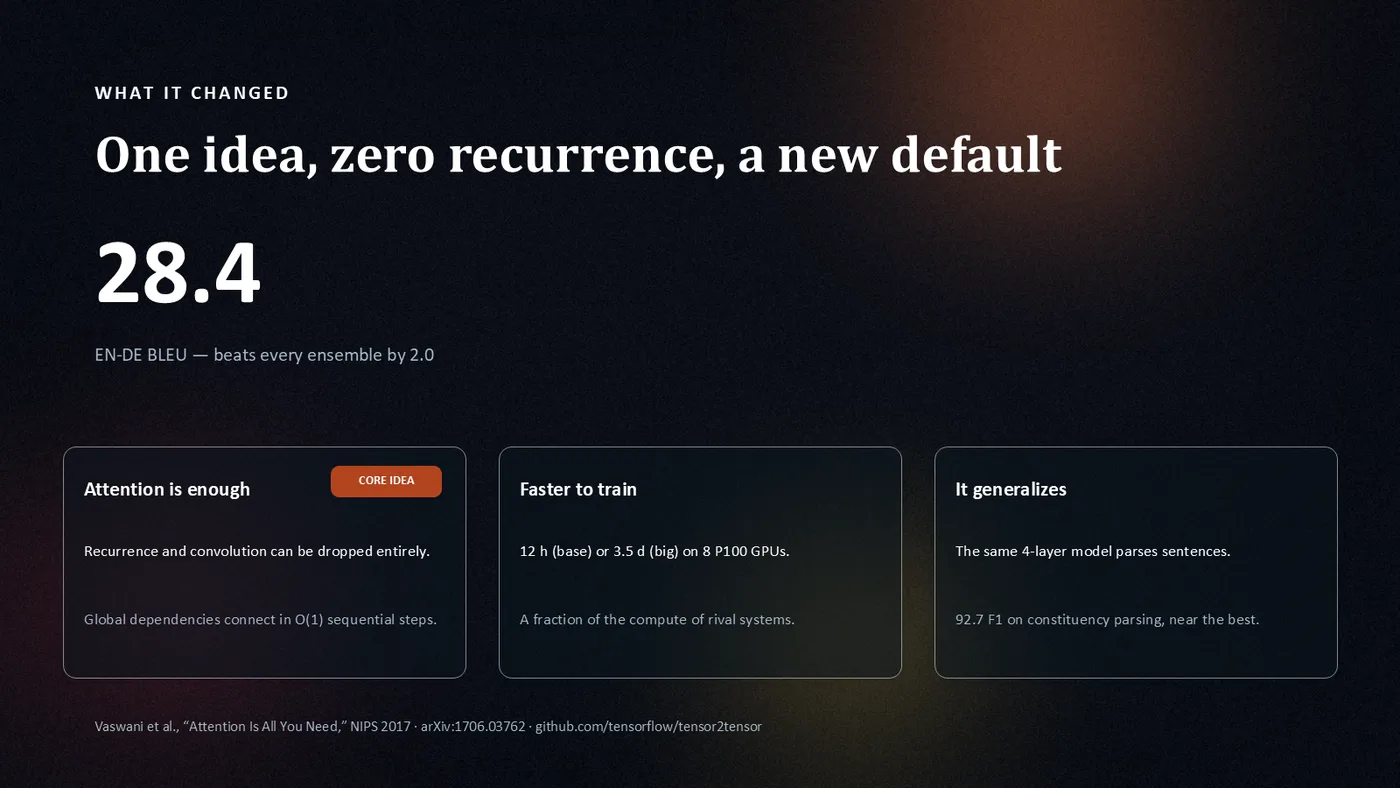
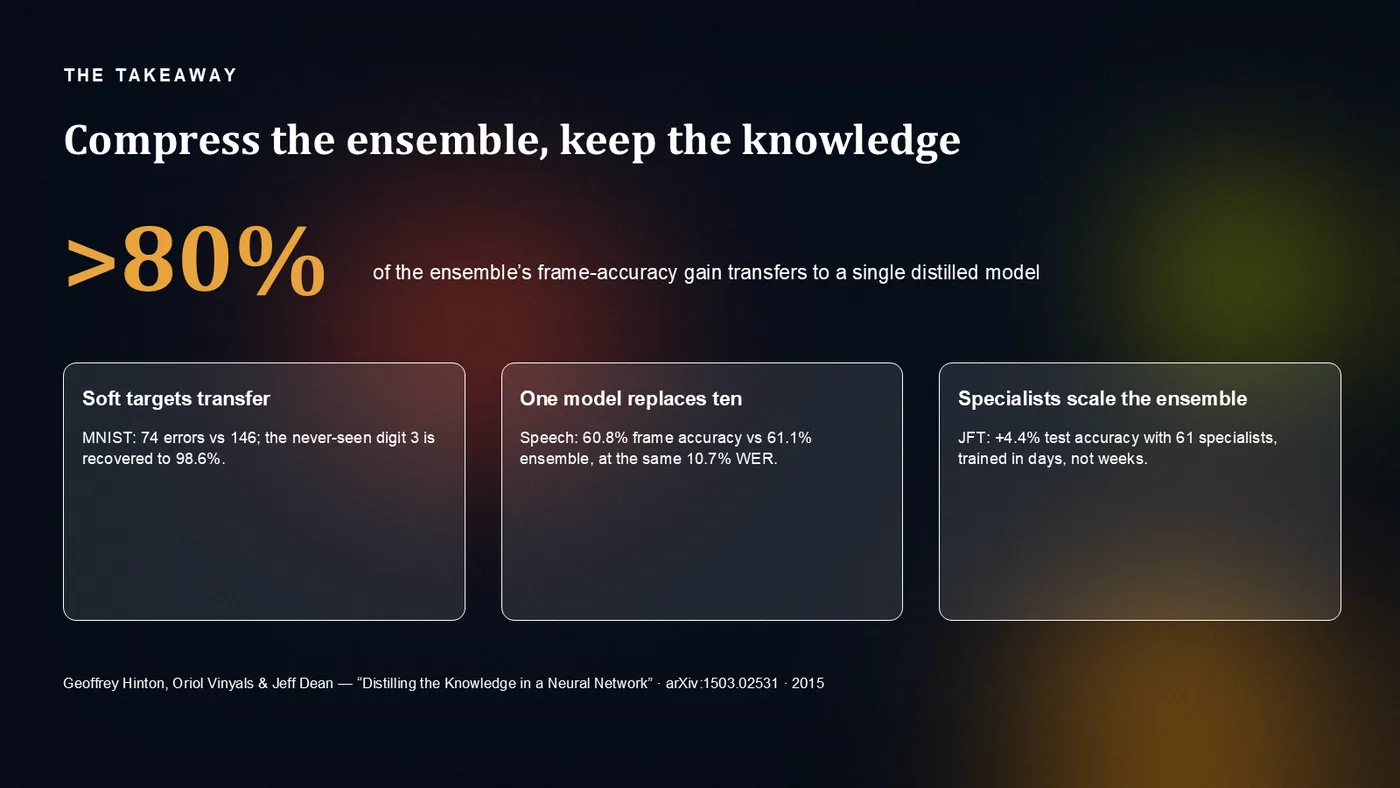
Backdrop: a real Dekked closing slide — One idea, zero recurrence, a new default.